Summary of Findings: Decision Tree
(Intelligence Application: 2.5 Of 5 Stars)
(Operational Application: 4 Of 5 Stars)
Note: This post represents the synthesis of the thoughts, procedures and experiences of others as represented in the articles read in advance (see previous posts) and the discussion among the students and instructor during the Advanced Analytic Techniques class at Mercyhurst University in September 2017 regarding Decision Tree as an Analytic Technique specifically. This technique was evaluated based on its overall validity, simplicity, flexibility and its ability to effectively use unstructured data.
Description:
Decision tree analysis is a flexible method of quantifying possible decisions via branching values based off of simple arithmetic. It is a decision support tool that uses a tree-like graph or model of decisions and their possible consequences, including chance event outcomes, resource costs, and utility. Although it is more commonly used as an operational method, it can be used to estimate possible decisions of rival organizations.
Strengths:
- Provides a clear visual representation of all possible decisions
- Cost-effective for the company or organization
- Easy to implement post-data verification
- Easy to communicate it to the decision maker
- Can be used to determine probabilities of different options or outcomes
- Can be used for both quantitative and qualitative data
- It can be combined with other analytical technique
- Can be easily modified if new alternatives are found
Weaknesses:
- Decision trees are extremely data dependent. Without reliable data, final estimates can be skewed
- Tends to be more of an operational method
- Becomes increasingly more complex as more decisions are implemented
- Allows for mirror imaging bias if complete data is not provided
- Expectation vs. reality: outcomes based off of actual decisions made may not be the same as predicted outcomes
- Assumes the creator of the decision tree knows all possible variables
How-To:
- Decide on a question you are trying to answer
- Define the problem or decision that is in question
- Start with a box or square that contains the decision you are trying to answer
- Gather relevant background data along with all desired or possible outcomes
- Begin to draw lines or branches out from your original question for each of the decisions you came up with, one branch for each possible choice
- Associate the costs of implementation of each decision
- Add the possible outcomes of these decisions and then assign probabilities (the probabilities must equal 100% to account for all possible outcomes)
- Assigned projected gains or losses to the projected outcomes
- Multiply the probability of each outcome with the outcomes projected gain or loss
- Add these values together for each outcome associated with that particular decision
- Choose decision with optimal outcomes based on equations
Application of Technique:
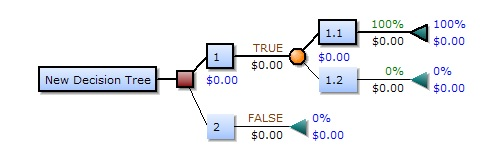
To demonstrate the application of the decision tree methodology, the class was led through two individual trees to understand the mechanisms. The first decision tree was a simplistic version of whether to invest in a candy cart or a lemonade stand. The class learned the fundamentals of a decision tree by examining the different components and their interactions. Generic values were substituted in for the example to emphasize the process of how to calculate the expected desired outcome.
Following the basic introduction to decision trees, the class undertook a more complex tree and calculated the expected desired outcome of a marketing company. The possible decisions included cutting costs, increased advertising, or to do nothing. Two new concepts: null decision and cost implementation were introduced in the second tree. Null decision would be selected if all other results came back negative. Cost implementation is the cost subtracted from the income shown for each decision.
For Further Information:


No comments:
Post a Comment